
A CISO gets a question from the board: which departments have gotten riskier this quarter, and why. In most organizations, that question triggers a small fire drill. Someone exports a spreadsheet. Someone else builds a chart in Power BI. A few days later, there's an answer, usually a snapshot of data that's already gone stale.
That delay isn't a people problem. It's an infrastructure problem, and it's the one Frame's Reports and Explore capabilities were built to close.
More templates were never the answer
Every security awareness platform will tell you how many reports it ships with. Sixty pre-built templates. A library of dashboards. Filters on filters. The pitch is always the same: whatever you need to see, it's already built.
It isn't. More templates just means more ways to almost have the report you actually need. The real question is what happens when your question doesn't match any of the sixty, and it usually doesn't. New departments get added. New signals get tracked. The board asks something nobody anticipated. By the time an engineer builds the custom view, ships it through a BI pipeline, or a support ticket gets answered, the question has already changed.
Static libraries can't keep pace with a live security program. They were never designed to.
Explore: ask the data directly
Frame's Insights suite includes Explore, a conversational interface connected directly to Frame's data lake. Type a question in plain language, "show me click rates by department for the last six months," and get a chart back in seconds. No SQL, no BI tool, no ticket filed and forgotten.
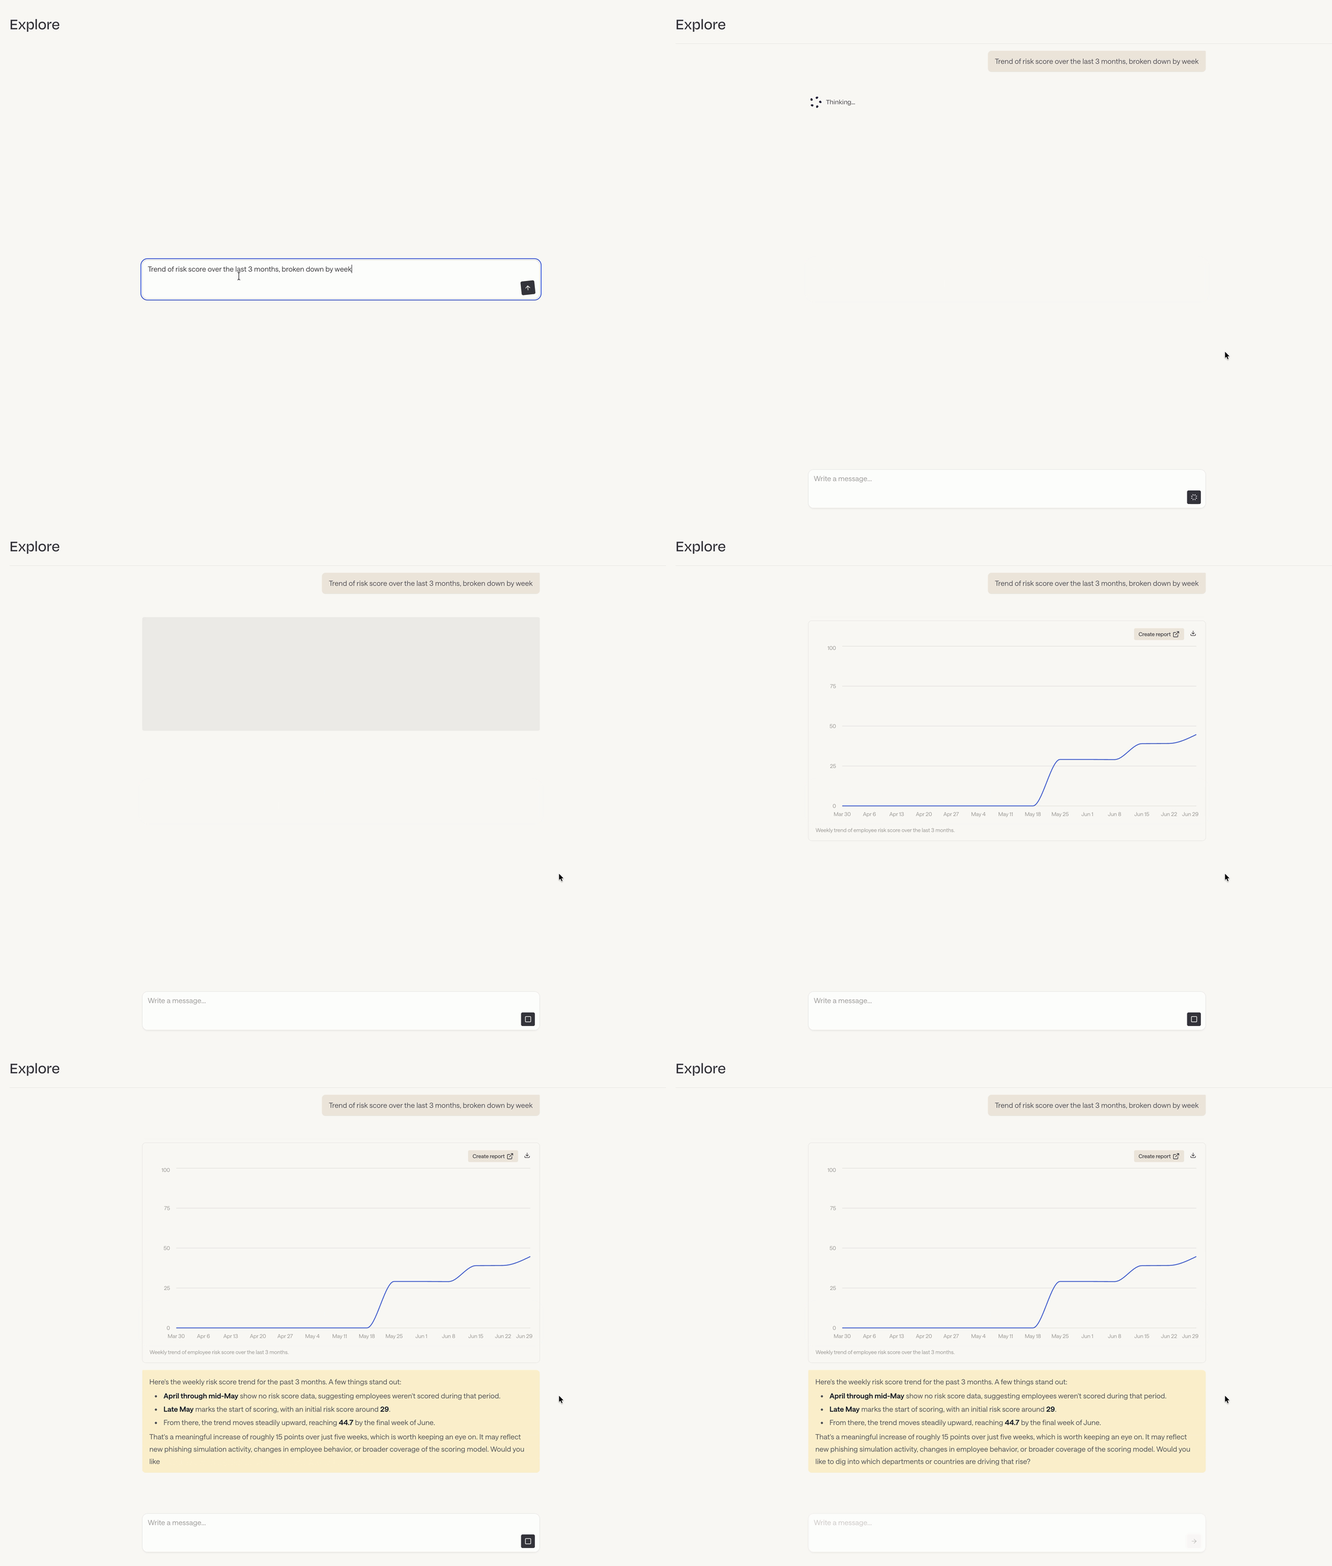
Explore doesn't stop at the first chart. Ask a follow-up, "break down the R&D department," and it drills further into the same conversation, no rebuilding, no starting over. It surfaces insights on its own, flagging when a department's click rate looks unusually high or a training trend is worth a second look. And it's connected to everything in Frame: phishing simulation results, training completion records, human risk scores. As Frame adds new signals and integrations, they're automatically available in Explore. No extra configuration, no waiting for the next release to catch up.
Reports: save it, don't rebuild it
An answer that lives for thirty seconds in a chat isn't enough for board reporting. That's what Reports is for, the save and reuse layer sitting on top of Explore. Any chart you generate can become a saved report with one click. Open it again next quarter, and the data refreshes automatically. Nothing gets rebuilt from scratch.
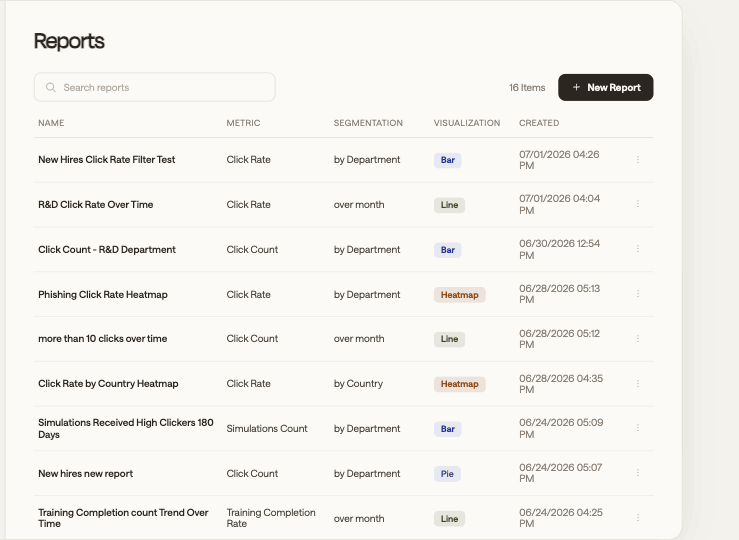
The chart library covers pie charts, bar charts, heat maps, and tables, and reports export to PNG, SVG, or CSV, formatted and ready for an executive deck without reformatting. Scheduled delivery and branded color palettes are coming in the next release cycle, so reports will land in an inbox automatically and carry your organization's logo and colors instead of a vendor's.
Today, the save and reuse layer alone eliminates the rebuild-every-cycle cost that eats up so much of a security team's reporting time.
The question stops being a fire drill
Go back to that CISO and that board question. With Explore and Reports, the process looks nothing like the spreadsheet chase. The question gets typed once. The chart appears in seconds. The insight gets surfaced without being asked for. And once it's saved, it's there next quarter too, refreshed and ready, without anyone rebuilding a thing.
The next time someone asks which department got riskier this quarter, the answer won't take a week. It'll take as long as it takes to type the question.
Schedule a demo of Frame today to learn more.
